
Nikiforov
Vladimir O.
D.Sc., Prof.


doi: 10.17586/2226-1494-2016-16-6-967-995
SUPERCOMPUTER SIMULATION OF CRITICAL PHENOMENA IN COMPLEX SOCIAL SYSTEMS
Read the full article
For citation: Sloot P.M.A., Holyst J., Kampis G., Lees M.H., Mityagin S.А., Ivanov S.V., Bochenina K.О., Guleva V.Yu., Mukhina K.D., Nasonov D.А., Butakov N.А., Leonenko V.А., Lantseva А.А., Boukhanovsky А.V. Supercomputer simulation of critical phenomena in complex social systems. Scientific and Technical Journal of Information Technologies, Mechanics and Optics, 2016, vol. 16, no. 6, pp. 967–995. doi: 10.17586/2226-1494-2016-16-6-967-995
Abstract
The paper describes a problem of computer simulation of critical phenomena in complex social systems on a petascale computing systems in frames of complex networks approach. The three-layer system of nested models of complex networks is proposed including aggregated analytical model to identify critical phenomena, detailed model of individualized network dynamics and model to adjust a topological structure of a complex network. The scalable parallel algorithm covering all layers of complex networks simulation is proposed. Performance of the algorithm is studied on different supercomputing systems. The issues of software and information infrastructure of complex networks simulation are discussed including organization of distributed calculations, crawling the data in social networks and results visualization. The applications of developed methods and technologies are considered including simulation of criminal networks disruption, fast rumors spreading in social networks, evolution of financial networks and epidemics spreading.
Acknowledgements. This paper is financially supported by the Russian Scientific Foundation, Agreement No.14–21–00137 (15.08.2014).
References
1. Castellano C., Fortunato S., Loreto V. Statistical physics of social dynamics. Reviews of Modern Physics, 2009, vol. 81, no. 2, pp. 591–646. doi: 10.1103/RevModPhys.81.591
2. Jiang L.L., Hua D.Y., Chen T. Nonequilibrium phase transitions in a model with social influence of inflexible units. Journal of Physics A: Mathematical and Theoretical, 2007, vol. 40, no. 37, pp. 11271–11276. doi: 10.1088/1751-8113/40/37/005
3. Bordogna C.M., Albano E.V. Statistical methods applied to the study of opinion formation models: a brief overview and results of a numerical study of a model based on the social impact theory. Journal of Physics Condensed Matter, 2007, vol. 19, no. 6, art. 065144. doi: 10.1088/0953-8984/19/6/065144
4. Fortunato S., Castellano C. Scaling and universality in proportional elections. Physical Review Letters, 2007, vol. 99, no. 13, art. 138701. doi: 10.1103/PhysRevLett.99.138701
5. Klimek P., Lambiotte R., Thurner S. Opinion formation in laggard societies. EPL, 2008, vol. 82, no. 2, art. 28008. doi: 10.1209/0295-5075/82/28008
6. Chmiel A., Sienkiewicz J., Thelwall M., Paltoglou G., Buckley K., Kappas A., Holyst J.A. Collective emotions online and their influence on community life. PloS One, 2011, vol. 6, no. 7, art. e22207 doi: 10.1371/journal.pone.0022207
7. Chmiel A., Holyst J.A. Transition due to preferential cluster growth of collective emotions in online communities. Physical Review E, 2013, vol. 87, no. 2, art. 022808. doi: 10.1103/PhysRevE.87.022808
8. Gil S., Zanette D.H. Coevolution of agents and networks: opinion spreading and community disconnection. Physics Letters A, 2006, vol. 356, no. 2, pp. 89–94. doi: 10.1016/j.physleta.2006.03.037
9. Kacperski K., Holyst J.A. Phase transitions and hysteresis in a cellular automata-based model of opinion formation. Journal of Statistical Physics, 1996, vol. 84, no. 1-2, pp. 169–189.
10. Newman M. Networks: An Introduction. Oxford University Press, 2010, 784 p.
11. Snijders T.A., Van de Bunt G.G., Steglich C.E.G. Introduction to stochastic actor-based models for network dynamics. Social Networks, 2010, vol. 32, pp. 44–60. doi: 10.1016/j.socnet.2009.02.004
12. Kumar R., Novak J., Tomkins A. Structure and evolution of online social networks. In Link Mining: Models, Algorithms, and Applications. NY, Springer, 2010, pp. 337–357. doi: 10.1007/978-1-4419-6515-8-13
13. Leskovec J., Huttenlocher D., Kleinberg J. Predicting positive and negative links in online social networks. Proc. 19th Int. Conf. on World Wide Web. Raleigh, USA, 2010, pp. 641–650. doi: 10.1145/1772690.1772756
14. Leskovec J., Chakrabarti D., Kleinberg J., Faloutsos C., Ghahramani Z. Kronecker graphs: an approach to modeling networks. Journal of Machine Learning Research, 2010, vol. 11, pp. 985–104.
15. Lamberson P.J., Page S.E. Tipping points. Quarterly Journal of Political Science, 2012, vol. 7, no. 2, pp. 175–208. doi: 10.1561/100.00011061
16. O’Regan S.M., Drake J.M. Theory of early warning signals of disease emergence and leading indicators of elimination. Theoretical Ecology, 2013, vol. 6, no. 3, pp. 333–357. doi: 10.1007/s12080-013-0185-5
17. Dorogovtsev S.N., Goltsev A.V., Mendes J.F.F. Critical phenomena in complex networks. Reviews of Modern Physics, 2007, vol. 80, no. 4, pp. 1275–1335. doi: 10.1103/RevModPhys.80.1275
18. Seoane L.F., Sole R. Phase transitions in Pareto optimal complex networks. Physical Review E - Statistical, Nonlinear, and Soft Matter Physics, 2015, vol. 92, art. 032807. doi: 10.1103/PhysRevE.92.032807
19. Ye C., Torsello A., Wilson R.C., Hancock E.R. Thermodynamics of time evolving networks. Lecture Notes in Computer Science, 2015, vol. 9069, pp. 315–324. doi: 10.1007/978-3-319-18224-7_31
20. Ni K.-Y., Lu T.-C. Information dynamic spectrum characterizes system instability toward critical transitions. EPJ Data Science, 2014, vol. 3, no. 1, pp. 1–25. doi: 10.1140/epjds/s13688-014-0028-7
21. Guleva V.Y. The combination of topology and nodes’ states dynamics as an early-warning signal of critical transition in a banking network model. Procedia Computer Science, 2016, vol. 80, pp. 1755–1764. doi: 10.1016/j.procs.2016.05.436
22. Luque B., Ballesteros F.J., Muro E.M. Self-organized critical random Boolean networks. Physical Review E - Statistical, Nonlinear, and Soft Matter Physics, 2001, vol. 63, no. 5, art. 51913. doi: 10.1103/PhysRevE.63.051913
23. Han H., Ma A., Huang Z. An improved SIRS epidemic model on complex network. Proc. Int. Conf. on Computational Intelligence and Software Engineering. Wuhan, China, 2009, art. 5365422. doi: 10.1109/CISE.2009.5365422
24. Delpini D., Battiston S., Riccaboni M., Gabbi G., Pammolli F., Caldarelli G. Evolution of controllability in interbank networks. Scientific Reports, 2013, vol. 3, art. 1626. doi: 10.1038/srep01626
25. Bisset K.R., Chen J., Feng X., Kumar V.S.A., Marathe M.V. EpiFast: a fast algorithm for large scale realistic epidemic simulations on distributed memory systems. Proc. 23rd Int. Conf. on Supercomputing. Yorktown, USA, 2009, pp. 430–439. doi: 10.1145/1542275.1542336
26. Hou B., Yao Y., Wang B., Liao D. Modeling and simulation of large-scale social networks using parallel discrete event simulation. Simulation, 2013, vol. 89, no. 10, pp. 1173–1183. doi: 10.1177/0037549713495752
27. Gonzalez J.E., Low Y., Gu H., Bickson D., Guestrin C. PowerGraph: distributed graph-parallel computation on natural graphs. Proc. 10th USENIX Conference on Operating Systems Design and Implementation. Hollywood, USA, 2012, pp. 17–30.
28. Liu Y.-Y., Slotine J.-J., Barabasi A.-L. Observability of complex systems. Proc. National Academy of Science of the USA, 2013, vol. 110, no. 7, pp. 2460–2465. doi: 10.1073/pnas.1215508110
29. Yoo A., Henderson K. Parallel generation of massive scale-free graphs. Proceedings of CoRR, 2010.
30. Ryu E., Choi S. Stochastic Kronecker Graph on Vertex-Centric BSP. Proceedings of CoRR, 2012, art. arXiv1208.2239.
31. Paul G., Tanizawa T., Havlin S., Stanley H.E. Optimization of robustness of complex networks. The European Physical Journal B - Condensed Matter and Complex Systems, 2004, vol. 38, no. 2, pp. 187–191. doi: 10.1140/epjb/e2004-00112-3
32. Watts D.J., Strogatz S.H. Collective dynamics of ‘small-world’ networks. Nature, 1998, vol. 393, no. 6684, pp. 440–442. doi: 10.1038/30918
33. Albert R., Barabasi A.L. Statistical mechanics of complex networks. Reviews of Modern Physics, 2002, vol. 74, no. 1, pp. 47–97. doi: 10.1103/RevModPhys.74.47
34. Newman M.E.J. The structure and function of complex networks. SIAM Review, 2003, vol. 45, no. 2, pp. 167–256.
35. Kashirin V.V. Evolutionary simulation of complex networks structures with specific topological properties. Procedia Computer Science, 2014, vol. 29, pp. 2401–2411. doi: 10.1016/j.procs.2014.05.224
36. Voloshin D.V., Puzyreva K.A., Karbovskii V.A. Agent-based virtual society polygon for simulation and evaluation in massive mobile services. IERI Procedia, 2014, vol. 10, pp. 231–238. doi: 10.1016/j.ieri.2014.09.082
37. Mahdian M., Xu Y. Stochastic kronecker graphs. Lecture Notes in Computer Science, 2007, vol. 4863, pp. 179–186.
38. Knyazkov K.V., Kovalchuk S.V., Tchurov T.N., Maryin S.V., Boukhanovsky A.V. CLAVIRE: e-Science infrastructure for data-driven computing. Journal of Computational Science, 2012, vol. 3, no. 6, pp. 504–510. doi: 10.1016/j.jocs.2012.08.006
39. Xiong F., Liu Y., Zhang Z.-J., Zhu J., Zhang Y. An information diffusion model based on retweeting mechanism for online social media. Physics Letters A, 2012, vol. 376, no. 30, pp. 2103–2108. doi: 10.1016/j.physleta.2012.05.021
40. Gjoka M., Kurant M., Butts C.T., Markoulou A. Walking in facebook: a case study of unbiased sampling of OSNs. Proceedings IEEE INFOCOM. San Diego, USA, 2010, art. 5462078. doi:10.1109/INFCOM.2010.5462078
41. Arnaboldi V., Conti M., Passarella A., Pezzoni F. Ego networks in twitter: an experimental analysis. Proceedings IEEE INFOCOM. Turin, Italy, 2013, pp. 3459–3464. doi: 10.1109/INFCOM.2013.6567181
42. Lee C.H., Xu X., Eun D.Y. Beyond random walk and metropolis-hastings samplers: why you should not backtrack for unbiased graph sampling. Performance Evaluation Review, 2012, vol. 40, no. 1, pp. 319–330. doi: 10.1145/2254756.2254795
43. Wang F., Landau D.P. Efficient, multiple-range random walk algorithm to calculate the density of states. Physical Review Letters, 2001, vol. 86, no. 10, pp. 2050–2053. doi: 10.1103/PhysRevLett.86.2050
44. Buccafurri F., Lax G., Nocera A., Ursino D. Crawling social internetworking systems. Proc. Int. Conf. on Advances in Social Networks Analysis and Mining, ASONAM. Istanbul, Turkey, 2012, pp. 506–510. doi: 10.1109/ASONAM.2012.87
45. Buccafurri F., Lax G., Nocera A., Ursino D. A system for extracting structural information from Social Network accounts. Software – Practice and Experience, 2015, vol. 45, no. 9, pp. 1251–1275. doi: 10.1002/spe.2280
46. Serrano D., Stroulia E., Barbosa D., Guana V. SociQL: a query language for the socialweb. Advances in Network Analysis and its Applications, 2012, vol. 18, pp. 381–406. doi: 10.1007/978-3-642-30904-5_17
47. Marcus A., Bernstein M.S., Badar O., Karger D.R., Madden S., Miller R.C. Processing and visualizing the data in tweets. SIGMOD Record, 2012, vol. 40, no. 4, pp. 21–27. doi: 10.1145/2094114.2094120
48. Psallidas F., Ntoulas A., Delis A. SocWeb: efficient monitoring of social network activities. Lecture Notes in Computer Science, 2013, vol. 8181, pp. 118–136. doi: 10.1007/978-3-642-41154-0_9
49. Hu Y., Shi L. Visualizing large graphs. Wiley Interdisciplinary Reviews: Computational Statistics, 2015, vol. 7, no. 2, pp. 115–136. doi: 10.1002/wics.1343
50. Auber D., Chiricote Y., Jourdan F., Melancon G. Multiscale visualization of small world networks. Proc. IEEE Symposium on Information Visualization. Seattle, USA, 2003, pp. 75–84.
51. Tominski C., Abello J., Van Ham F., Schumann H. Fisheye tree views and lenses for graph visualization. Proc. Int. Conf. on Information Visualization. London, 2006, pp. 17–24. doi: 10.1109/IV.2006.54
52. Bender-deMoll S., McFarland D.A. The art and science of dynamic network visualization. Journal of Social Structure, 2006, vol. 7, no. 2, pp. 1–38.
53. Moody J., McFarland D., Bender-deMoll S. Dynamic network visualization. American Journal of Sociology, 2005, vol. 110, pp. 1206–1241. doi: 10.1086/421509
54. Collberg C., Kobourov S., Nagra J., Pitts J., Wampler K. A system for graph-based visualization of the evolution of software. Proc. ACM Symposium on Software Visualization. San Diego, USA, 2003, pp. 77–86.
55. Ahn J.-W., Taieb-Maimon M., Sopan A., Plaisant C., Shneiderman B. Temporal visualization of social network dynamics: prototypes for nation of neighbors. Lecture Notes in Computer Science, 2011, vol. 6589, pp. 309–316. doi: 10.1007/978-3-642-19656-0_43
56. Egorov D., Bezgodov A. Improved force-directed method of graph layout generation with adaptive step length. Procedia Computer Science, 2015, vol. 66, pp. 689–696. doi: 10.1016/j.procs.2015.11.078
57. Guschin A., Shmelev V., Karbovskii V. Use of modern information and computer technologies in historical and urban studies with the example of epidemiological situation in the city of Simbirsk during the First World War. Proc. 9th Int. Conf. on Application of Information and Communication Technologies. Rostov-on-Don, Russia, 2015, pp. 527–530. doi: 10.1109/ICAICT.2015.7338616
58. Goodhart C., Hofmann B., Segoviano M. Bank regulation and macroeconomic fluctuations. Oxford Review of Economic Policy, 2004, vol. 20, no. 4, pp. 591–615. doi: 10.1093/oxrep/grh034
59. Rudebusch G.D. et al. Macroeconomic models for monetary policy. FRBSF Economic Letter, 2002.
60. Sparrow M.K. The application of network analysis to criminal intelligence: an assessment of the prospects. Social Networks, 1991, vol. 13, no. 3, pp. 251–274. doi: 10.1016/0378-8733(91)90008-H
61. Duijn P.A.C., Klerks P. Social network analysis applied to criminal networks: recent developments in Dutch law enforcement. In: Networks and Network Analysis for Defense and Security. Springer, 2014, pp. 121–159. doi: 10.1007/978-3-319-04147-6_6
62. Milward H.B., Raab J. Dark networks as organizational problems: elements of a theory. International Public Management Journal, 2006, vol. 9, no. 3, pp. 333–360. doi: 10.1080/10967490600899747
63. Duijn P.A.C., Kashirin V., Sloot P.M.A. The relative ineffectiveness of criminal network disruption. Scientific Reports, 2013, vol. 4, art. 4238. doi: 10.1038/srep04238
PICTURES
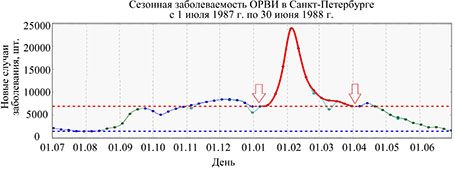
Fig. 1.Daily schedule of influenza in Saint Petersburg from July 1st, 1987 to June 30,1988. The blue color denotes deviation in data due to the failure to take into account cases by the health authorities in the festive period. Blue and red horizontal lines mark the average levels of the incidence of acute respiratory viral infection (ARVI) in summer, autumn and spring periods, respectively. The red solid line marks the incidence of disease during the epidemic of influenza. The moments of occurrence of critical conditions (transitions from seasonal ARVI to epidemic and back) are marked by arrows
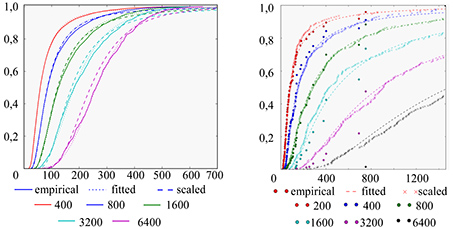
Fig.2. GEV scaling for samples of different sizes obtained from Barabasi– Albert graph with the size equal to 25600 nodes (empirical – empirical distribution, fitted – GEV evaluation based on empirical distribution, scaled – distribution, obtained by squaring fitted for sample of half the size). Averaging over 1000 runs (a); GEV scaling for samples from the graph AutonomousSystems (routers in the Internet), the graph size is 6400 nodes. The size of the set of samples for estimation of GEV is 250 (b)
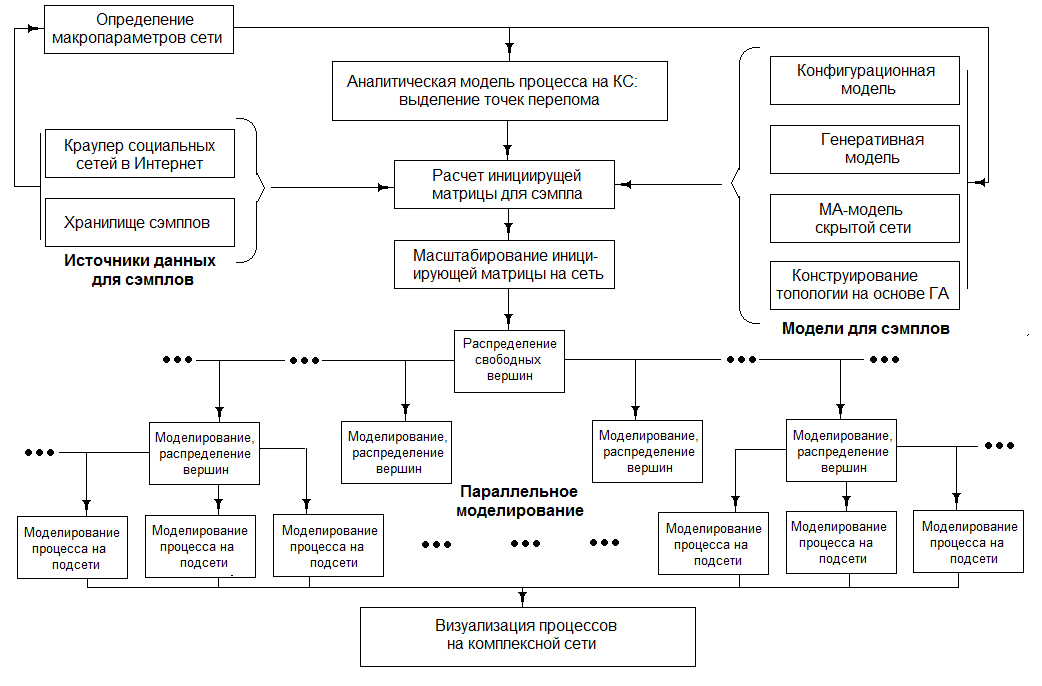
Fig. 3. A general technique for modeling of critical states in complex social systems based on the formalism of complex networks with the models "A"–"B" (GA genetic algorithm)
a) b)
c)
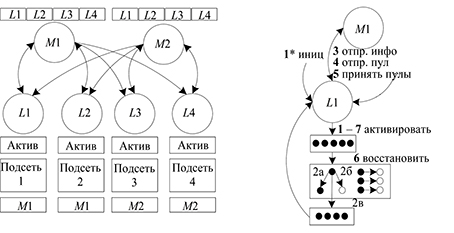
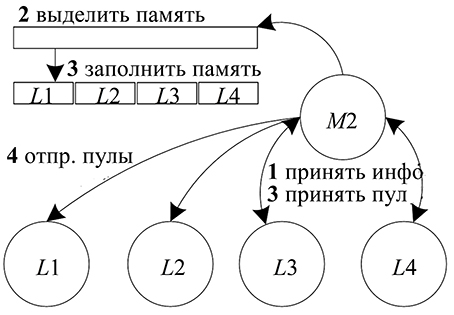
Fig. 4. Organization of communication between subnets (a); operation algorithm of the M-process (b); operation algorithm of the L-process (in)
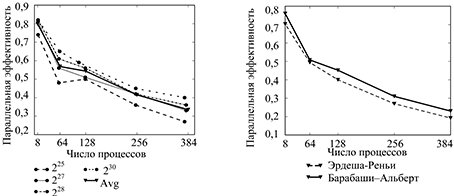
Fig. 5. Parallel efficiency: as-route initiating matrix, Pact=0.5, Prec =0.2, C=2.05, Pini =0,01, N=25, Avg – averaging over different sizes of graphs (a); Erdos–Renyi initiating matrix, Pact=0.4, Prec=0,142, C=2,05, Pini=0.1, N=50 and Barabasi–Albert initiating matrix (for parameters see Fig. 5, a) (b)
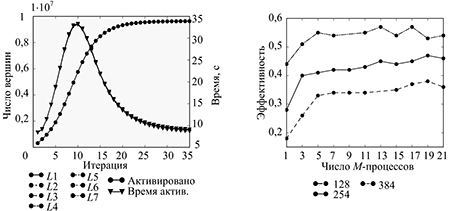
Fig. 6 The number of activated nodes and the activation time for variousL-processes for Barabasi–Albert initiating matrix Pact=0.3, Prec=0.2, C=2.005, Pini=0.015, N=35, V=230(a); efficiency for different number of M processes, as route initiating matrix, V=230(b)
Albert initiating matrix (for parameters see Fig. 5, a) (b)
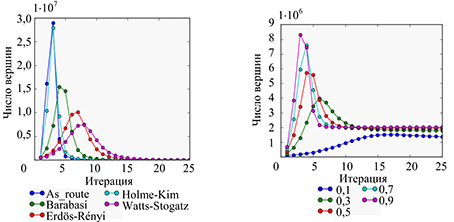
Fig. 7. The number of edges that are added in an iteration for various types of initiating matrices Pact=0.5, Prec=0.3, C=2.1, Pini=0.015, N=35, Nk=24 (a); the number of activated vertices for different Pact, initiating Barabasi–Albert matrix with parameters: Nk=25, Prec=0.1, N=25 (b)
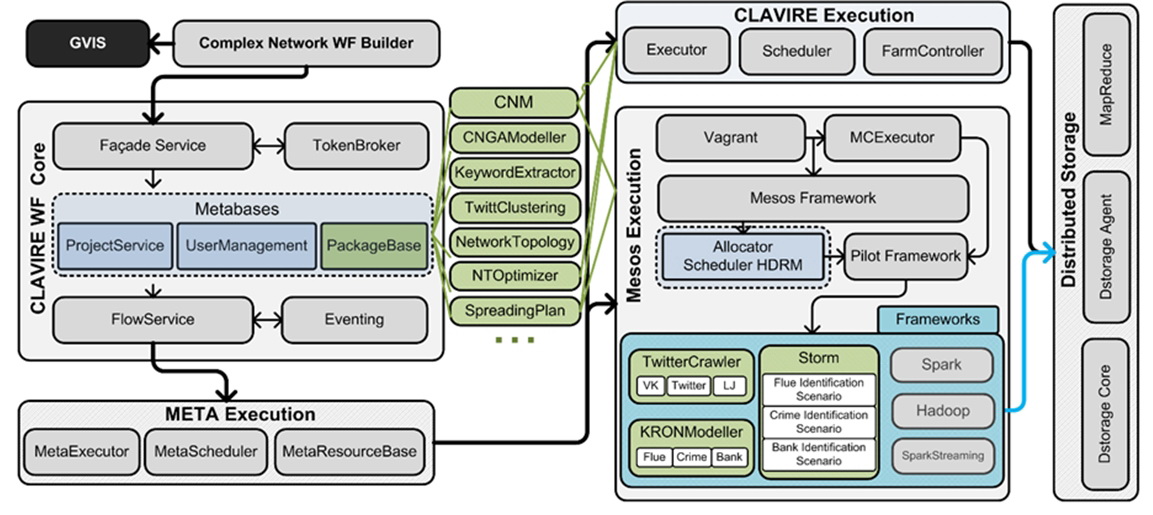
Fig. 8. A general diagram of the architecture of the modeling complex of critical phenomena of complex social systems
a)
b)
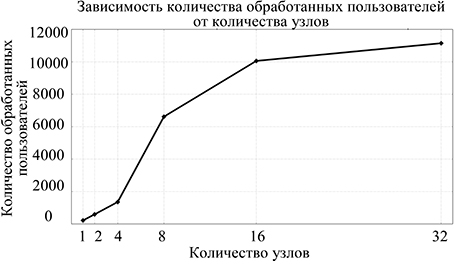
Fig. 9. Performance evaluation of data collection depending on the number of crawler agents on the example of the Twitter social network: the time (in seconds) to gather information on 4,000 users (a); the number of collected users for a fixed time – 7 min (b)

a) b) c)
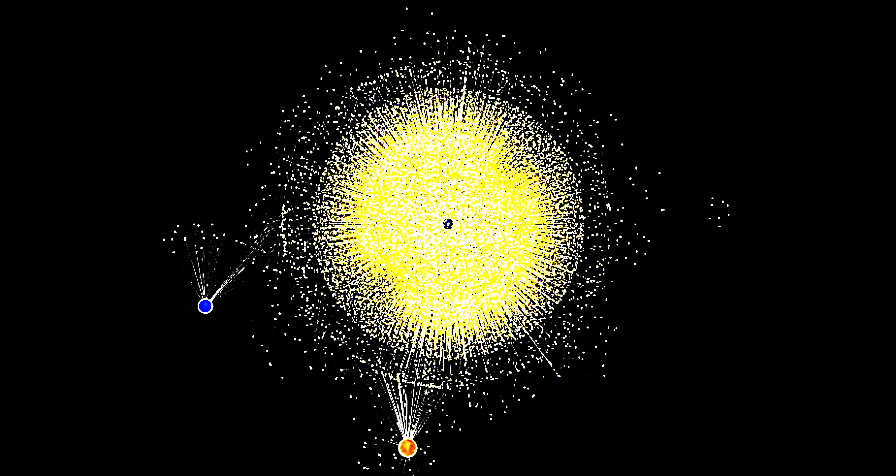
Fig. 10. An example of dynamic process visualization of rumors spread via mobile communication networks: distribution of awareness at the initial time moment (a); after 20 hours of model time (b); after the end of modeling (b)
a)
b)
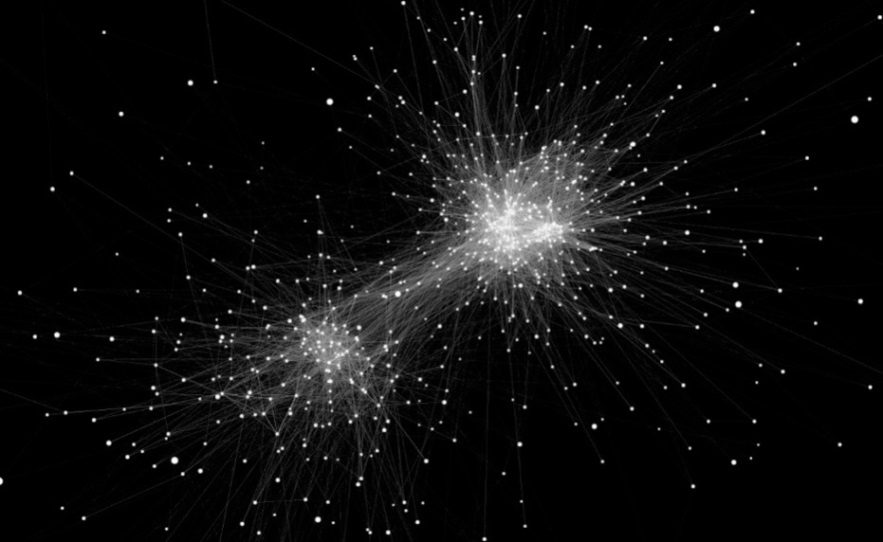
Fig. 11. Examples of visualization algorithm of complex networks: graph of treatment profiles of patients in a large medical center (a); a chain of posts from the social network VKontakte (b)
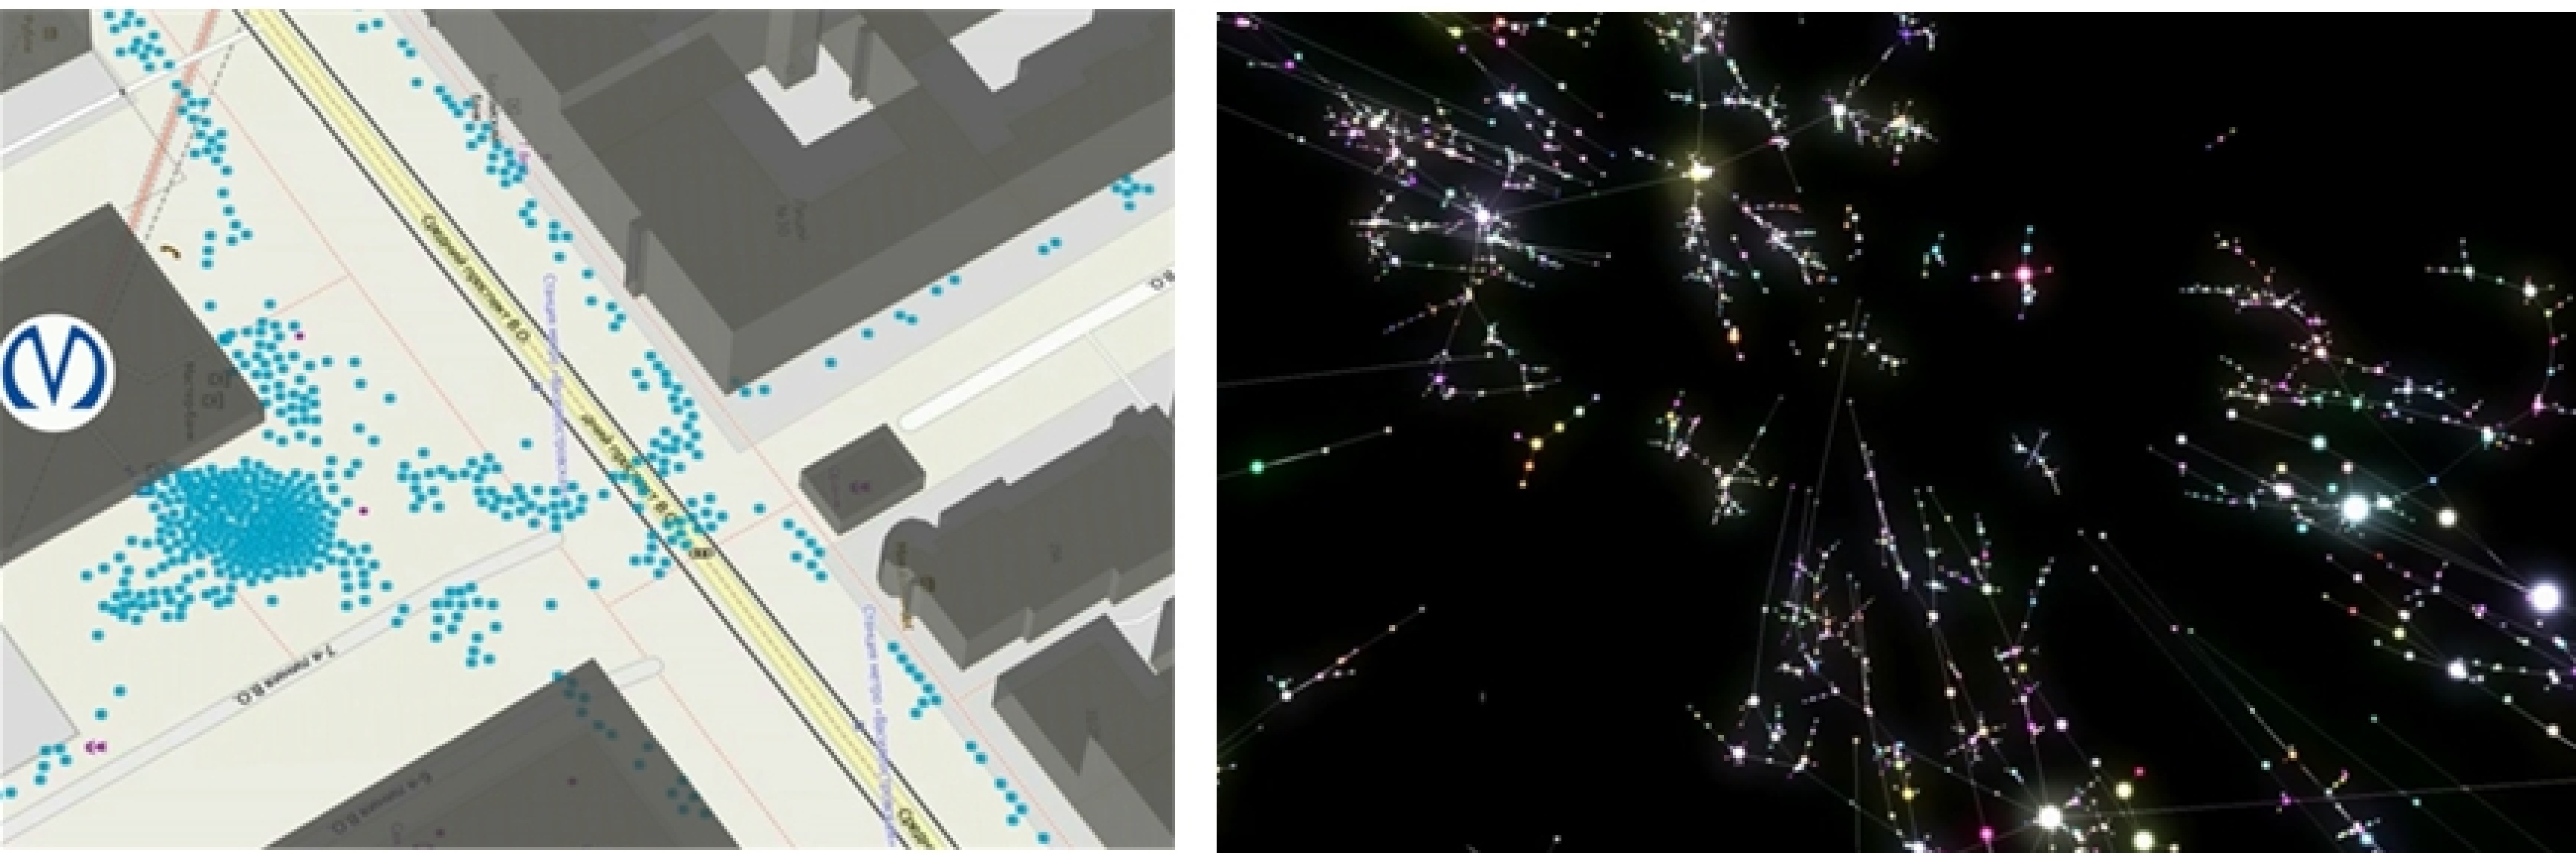
Fig. 12. The creation of epidemiological contact network based on the MA-modeling of people’s mobility at the micro level: a fragment of the movement scene of agents in an urban environment (a); modeling of infection propagation processes in contact network (b)
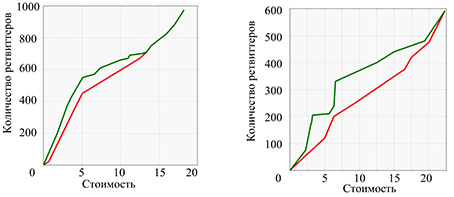
a) b)
Fig. 13. Effectiveness evaluation of optimization methods of information dissemination process in Twitter: by the solutions found by GA (genetic algorithm is a genetic algorithm, green line) and solutions with the greatest number of subscribers HD (highest degree is the highest degree of the vertex, red line): the relevance of the tweet for 24 hours (a); the relevance of the tweet 12 hours (b)
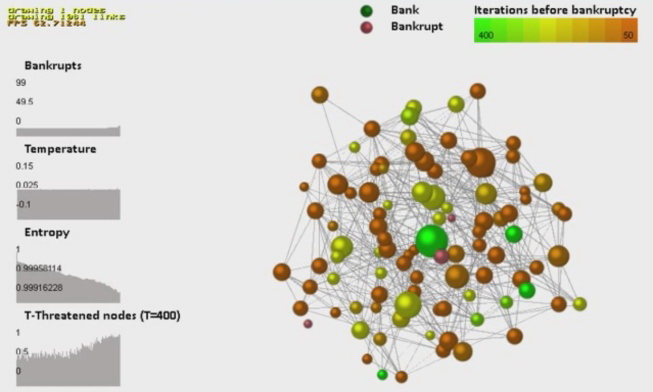
a)
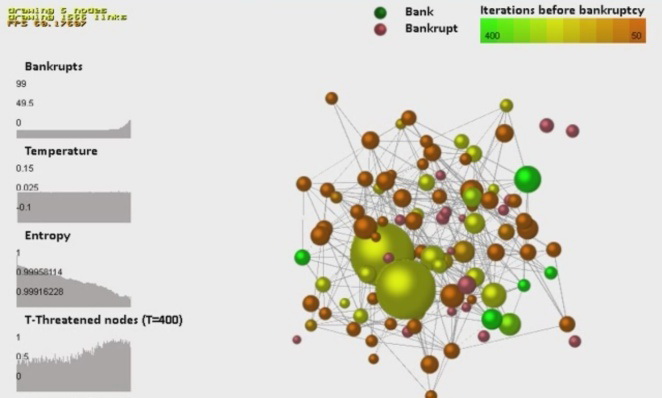
b)
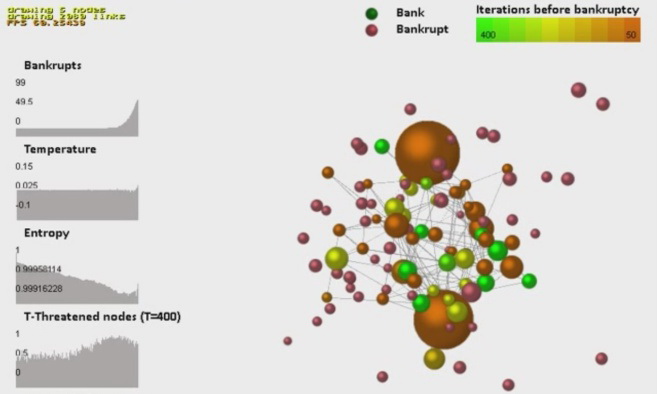
c)
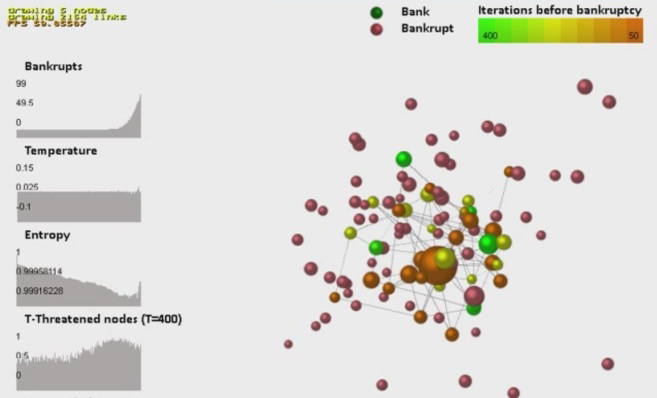
d)
Fig. 14. Model dynamics of changes in the banking network to the complete destruction as a result of a cascade of contagious defaults (а–g). The size of the dots corresponds to the values of the bank assets, the color corresponds to the estimated number of iterations before the bank default. The graphs in the figures (from top to bottom) reflect the dynamics of changes in the number of bank defaults in the system, temperature, entropy, and the proportion of nodes with negative dynamics
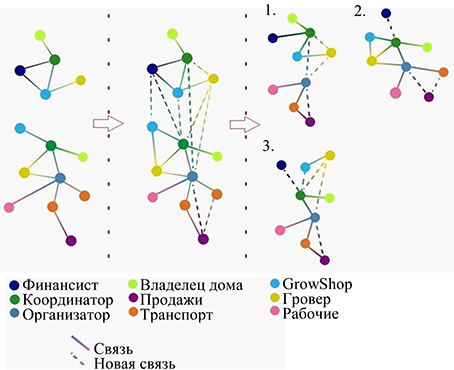
Fig. 15. The restoration of criminal network fragment followed by the separation of three combinations of chains
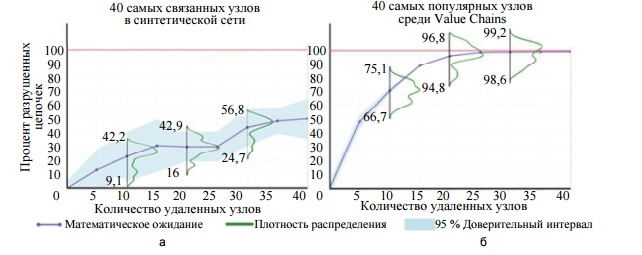
Fig. 16. The outcomes of two destruction strategies: removal of vertices with the highest degree (a); removal of vertices with the most frequent appearance in various combinations of chains (b)
